Dynatrace & Palo Alto Alerting
The Palo Firewalls required enhanced monitoring and alerting to help manage issues pro-actively for the Platform Operations Team.
Palo Alto virtual machines generate logs both system and network that is stored in Panorama/Splunk.
Request Dynatrace Access
If you require access to the Dynatrace dashboard, you will need to raise a servicenow ticket link - provide your email address (justice) - dashboard (non-prod) - reason for access (manage / access alerts) - team you’re in (platops)
Then contact Jonathan Forster on the dyntrace-help-admins slack channel - link and provide your ticket number, he will then advise access is provided via slack.
Use your email address to login, no password is required andthe palo dashboard can be accessed here.
Dynatrace Alerts
We have the below configured in IAC infrastructure in hub-panorama-terraform repolink.
These events are triggered when threshold is surpassed 3 times out of 5 in the space of a 1 minute window ie CPU limit is above 90, for non-prod & prod.
- Load Balancer Availbility - threshold for an alert is below 100% availability.
- Load Balancer Health Probe - threshold for an alert is below 100% availability.
- Palo Alto VM Memory Utilisation - threshold for an alert is above 26 mb memory utilisation.
- Palo Alto VM CPU - Azure Metrics - threshold for an alert is above 80 based CPU from Azure Metrics.
- Palo Alto VM CPU MGMT - SNMP Data - threshold for an alert is above 80 for Palo Alto management CPU alert on SNMP data.
- Palo Alto VM CPU- SNMP Traps Data - threshold for an alert is above 80 Palo Alto metric alert bases on SNMP traps data.
- Session Count ICMP - threshold for an alert is above 7k session count.
- Session Count TCP - threshold for an alert is above 26k session count.
Slack Alerts
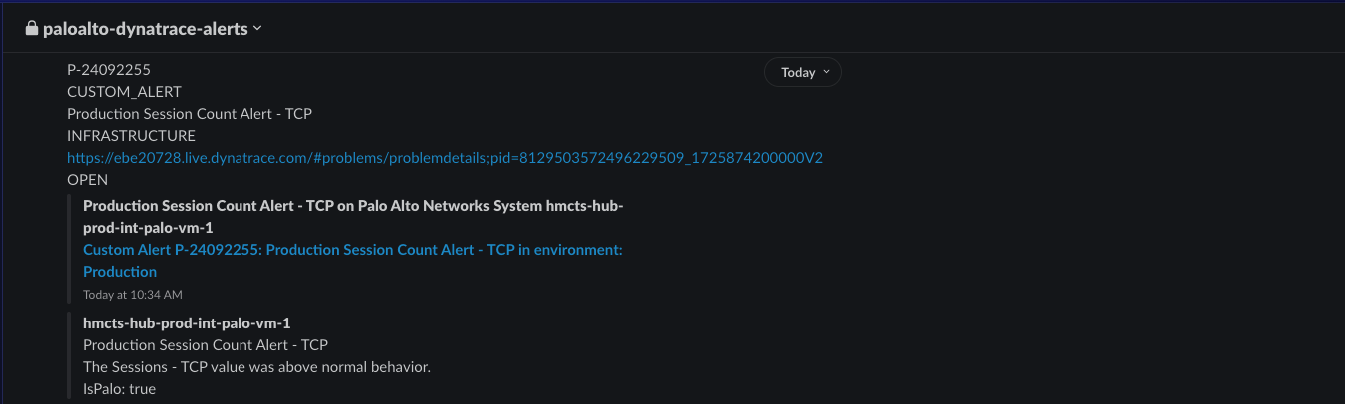
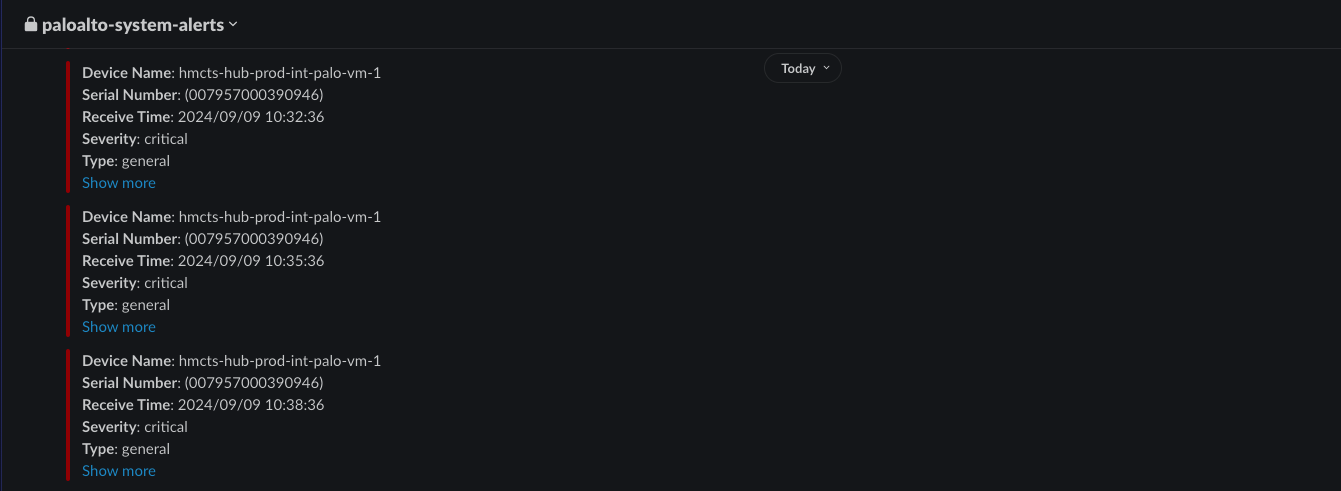
When a threshold has been violated it will posted on the below slack channels to viewed with the information about the alert.
Please note you’ll need to be invited to the channel for access from a member of the Red Squad link.
- paloalto-dynatrace-alerts link.
- paloalto-system-alerts link.
Manual Alert Testing
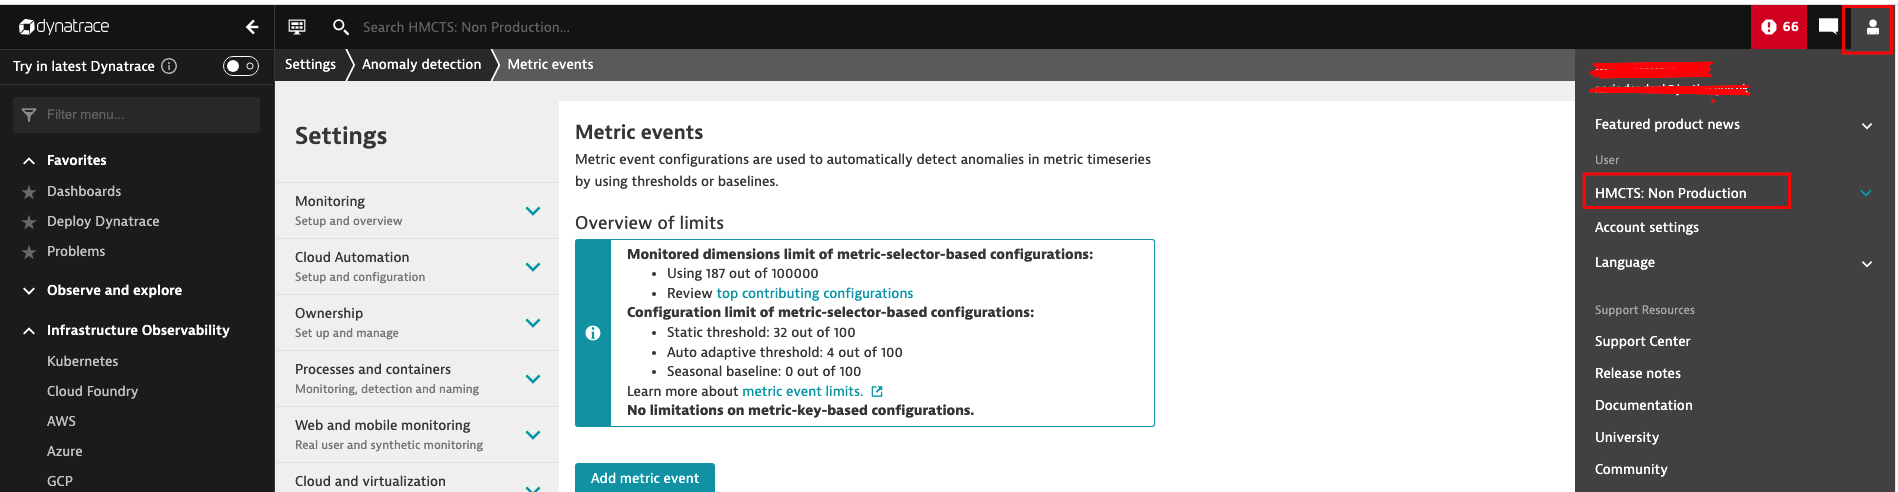
The above metrics were tested manually on Dynatrace dashboard non-prod (click on the top right head icon to see which dashboard you’re on) prior to being committed to IAC.
You’ll find the Terraform resource for new metric events link.
Test metrics can be found on the left side panel, Manage -> settings -> Anomaly detection -> Metric events, within the filter type ‘palo" to see prior examples.
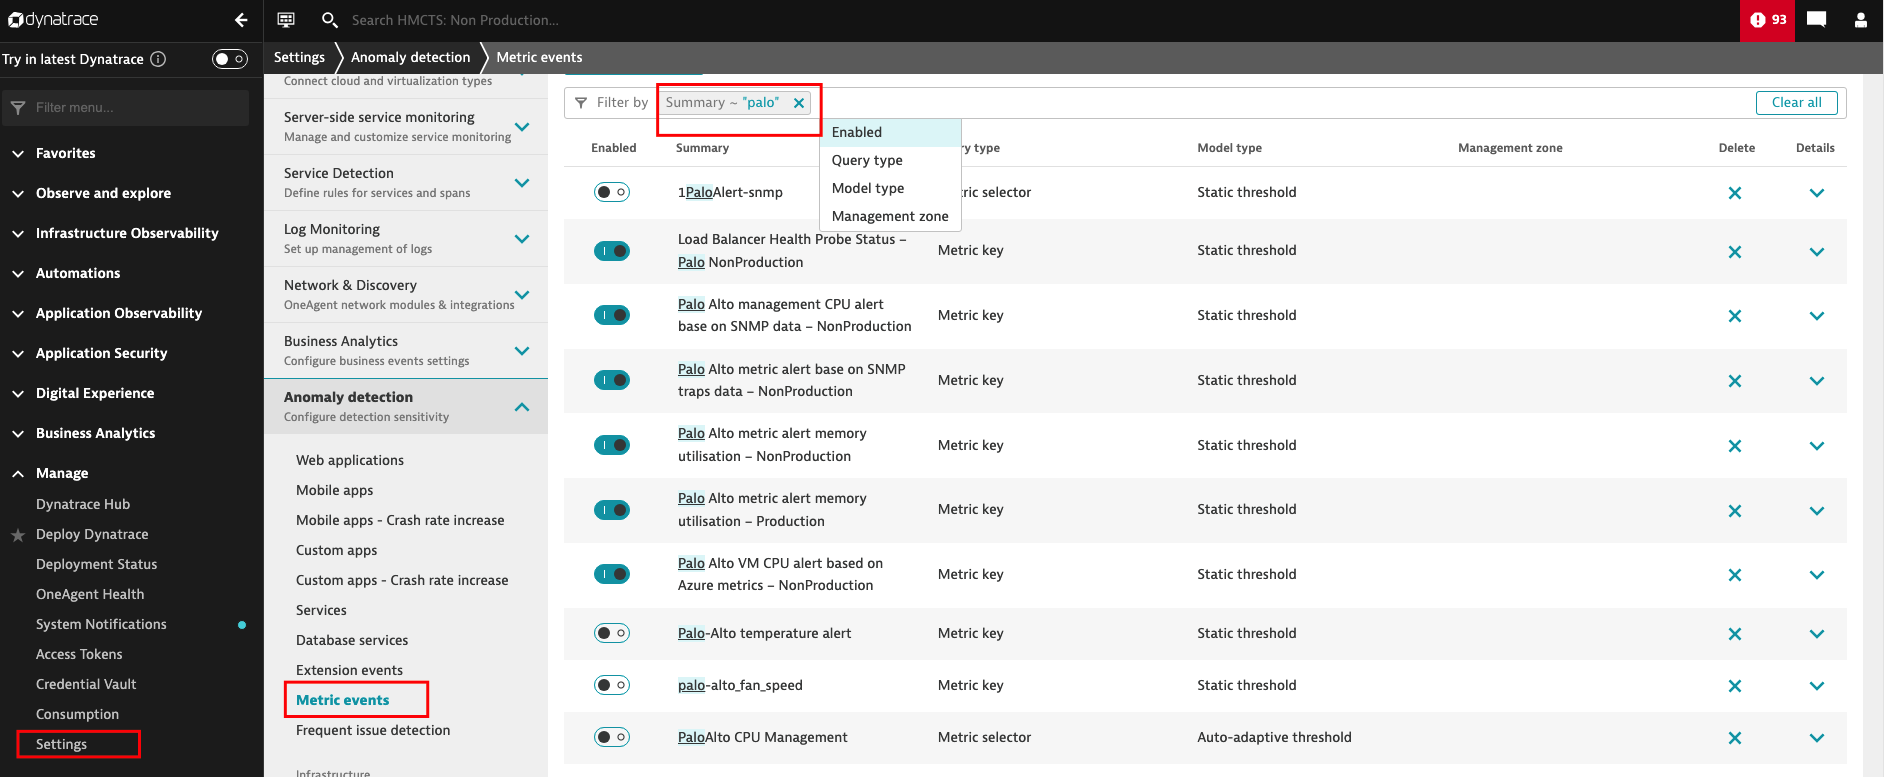
Please ensure that you only amend those that are not enabled (not green) e.g 1PaloAlert-snmp, to test future metrics, example of load balancing link.
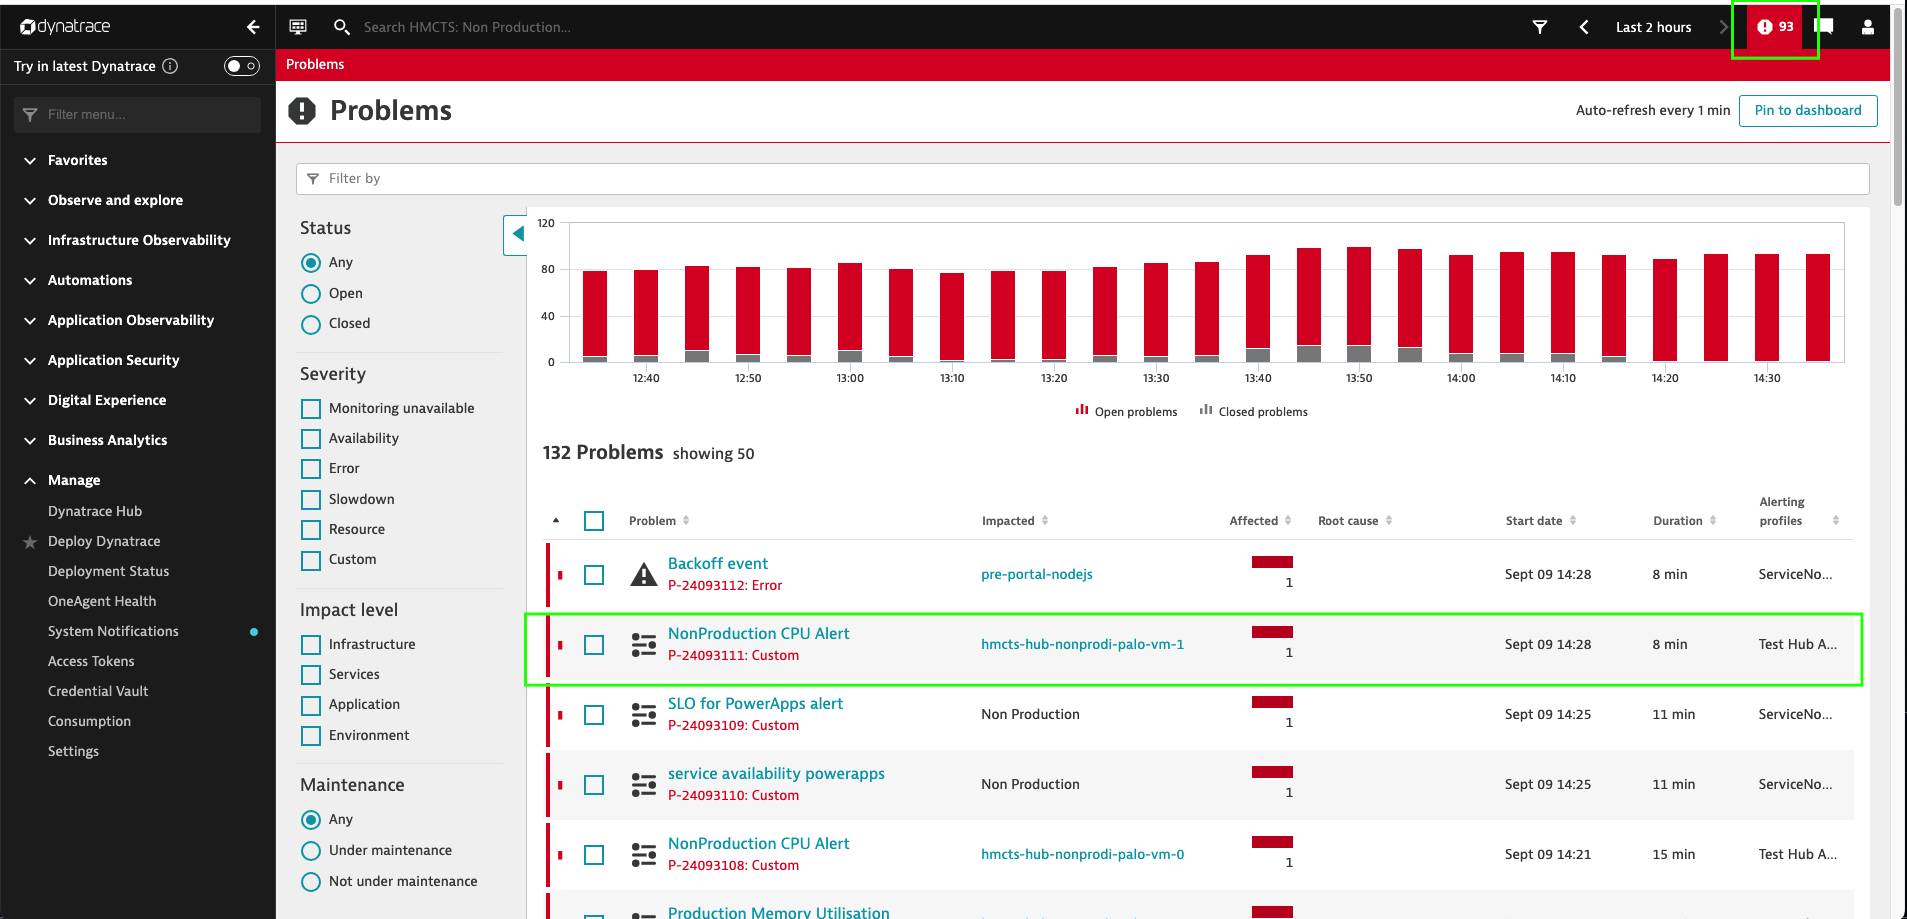
You will know the alert has been triggered as it will show up as a problem in the top right corner of the dashboard in a red box containing a exclamation mark.
You need to set the threshold above or below the expected, i.e. CPU below 10% to trigger a problem, through using metric events outlines link.
You’ll set your required parameters based on the current metrics under Infrastructure Observability->Azure and find the resource under the subscription hmcts-hub-nonprod-intsvc, review a resource e.g. virtual machine, to find suitable metric event point to trigger an alert.
Dyntrace provide documentation on metric key events based on incoming raw measurements of a single metric link and this will provide the fields required in the terraform block of code once tested.
Slack Integration
The following documents provide the steps to set up integration with slack.
- Set up a slack channel link.
- Http log intergartion link is set up on sbox, non-prod and prod palo alto vm’s.
- Integrating Slack and Palo Alto Network Firewalls link, this document provides the steps to get notifications in slack for system alerts from the palo alto firewalls.
- Web Hooks for slack link step to send messages to slack.
These will notify of any palo alto system issues that are of critical and or high severity. The alert set up can be found on the Panorama under Device -> log settings.
You can view these alerts under the monitor -> system and filter the criteria with (severity eq high) or (severity eq critical) query on the Panorama and here’s a link on how to access Panorama’s.