How SonarQube works on Jenkins
In our shared Jenkins pipeline, we perform static code analysis using SonarQube.
We have an organisation set up in Sonarcloud which you can sign into using your GitHub account.
When the pipeline runs, it connects to Sonarcloud and it performs the analysis.
Sonarcloud then sends a request to a webhook on Jenkins so Jenkins can determine if it was a success or failure and proceed or exit the pipeline as appropriate.
Webhooks
In Sonarcloud, webhooks have been configured for each of our Jenkins instances.
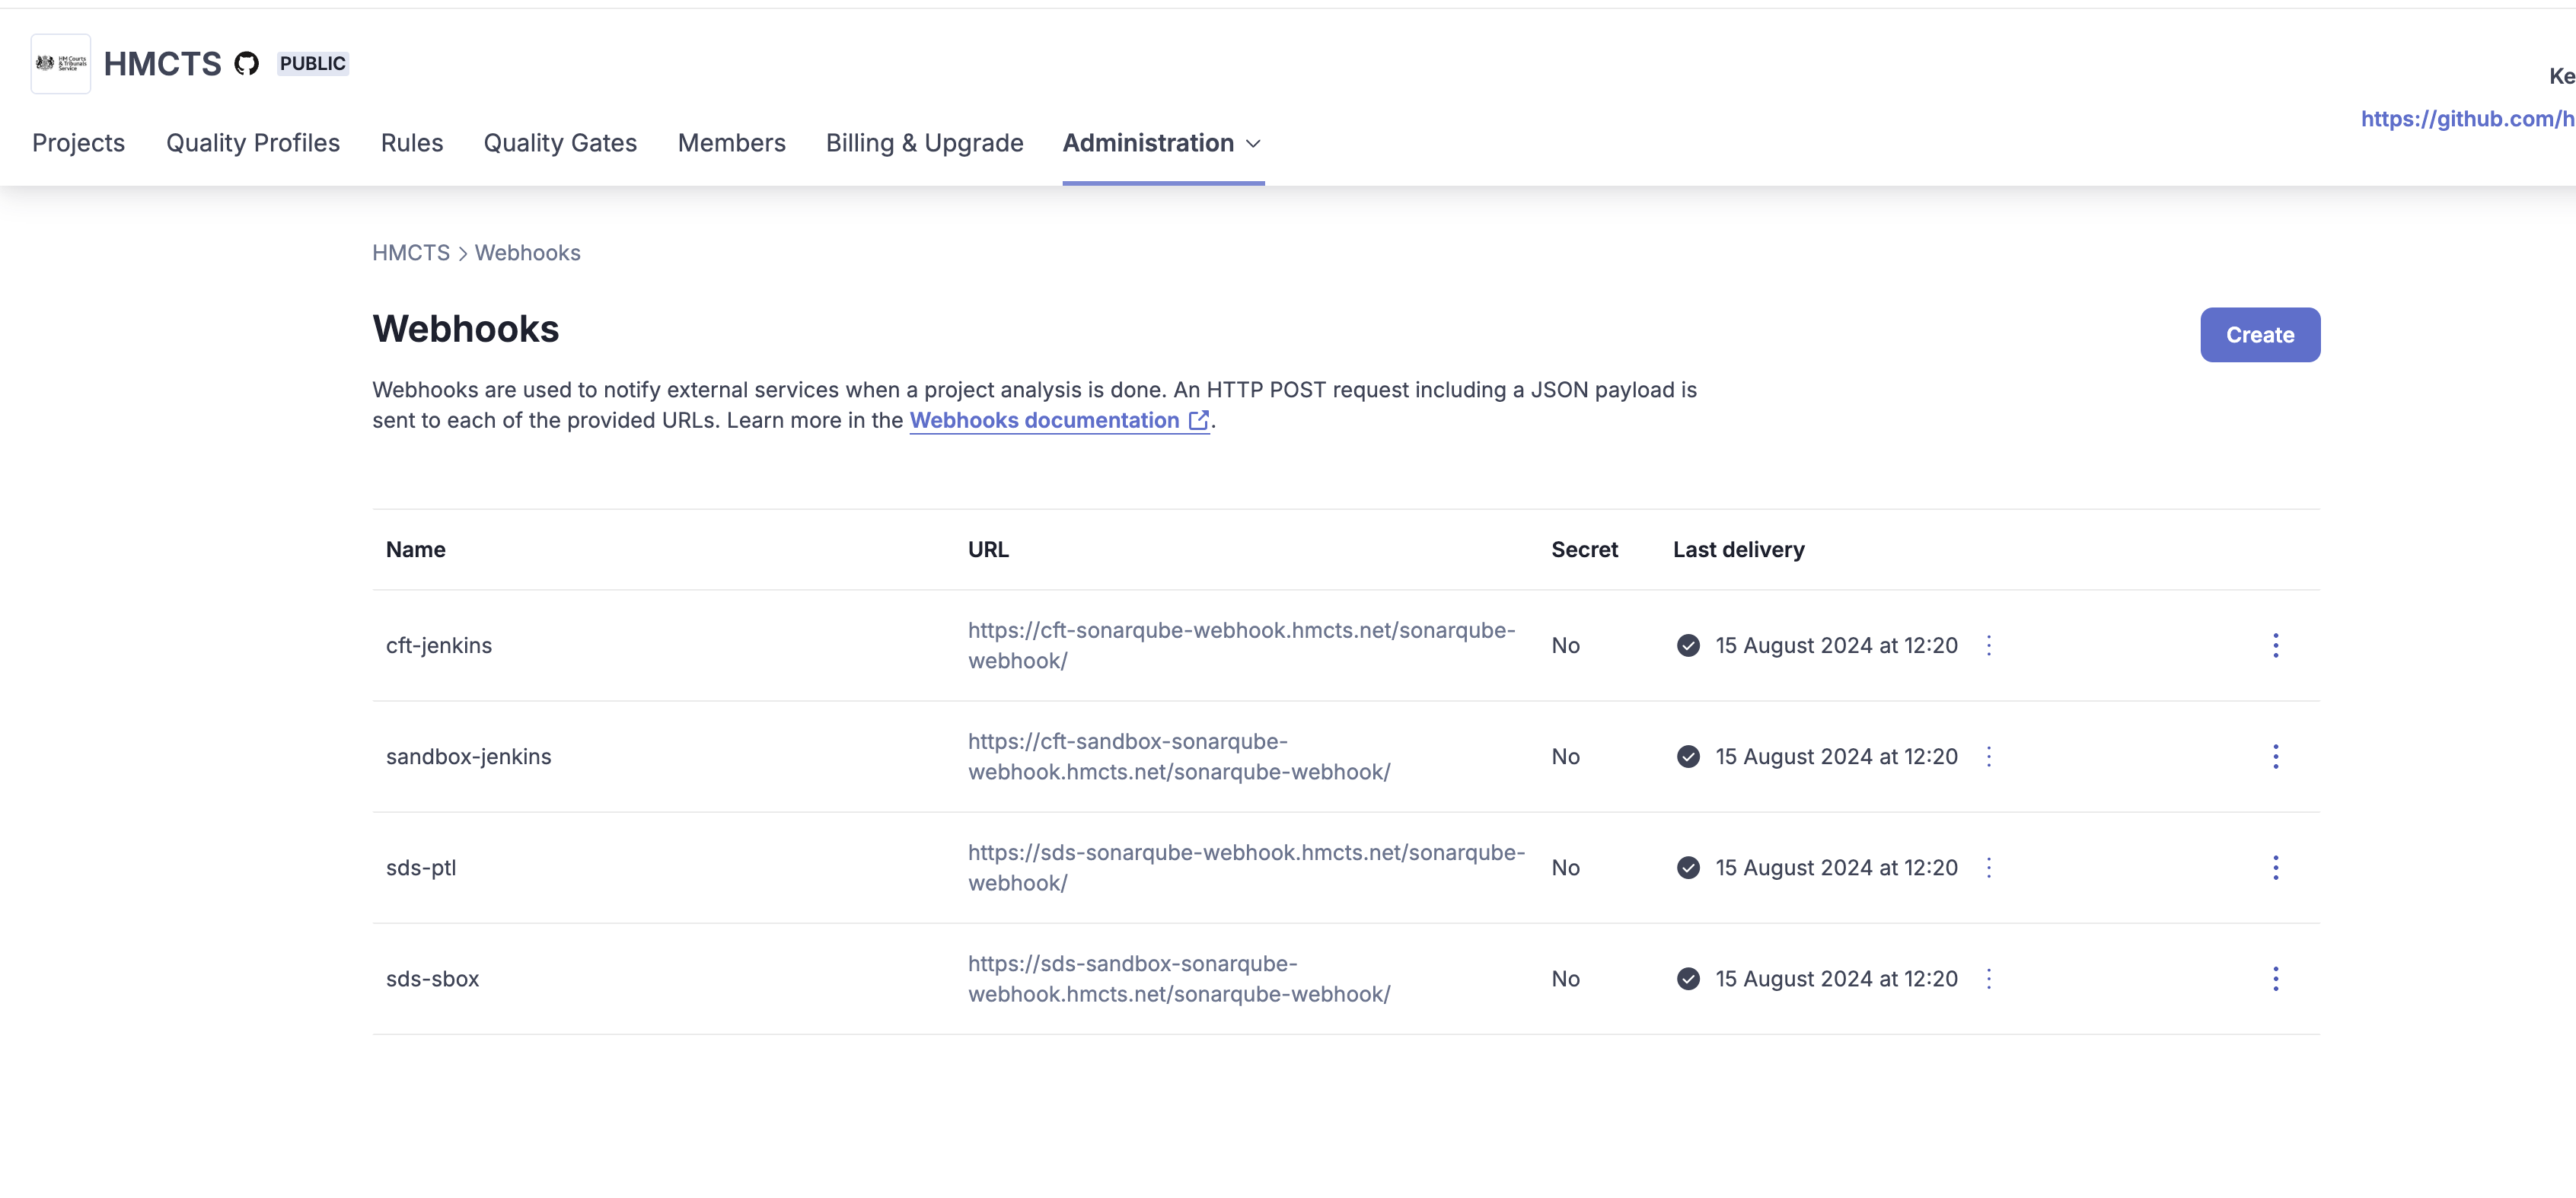
Each of the URLs has been setup on Jenkins as a kubernetes ingress.
Here is a link to the ingress for our CFT PTL Jenkins instance.
This ingress is then exposed via Azure App Proxy to make it reachable by Sonarcloud.
Here is a link to the configuration for the webhook on CFT PTL Jenkins.
The URLs on App Proxy have been configured with passthru authentication as we don’t have any Entra ID authentication from Sonarcloud.
Checking SonarQube results are reaching Jenkins
We had a PlatOps Help ticket come in saying sonar scans were timing out.
This was blocking pipelines from passing the scanning stage.
In order to figure out what was happening, we checked the logs on Jenkins. You can check the logs on the AKS cluster by running kubectl logs jenkins-0 -n jenkins and grep for sonar.
Or, you can go to the Jenkins UI > Manage Jenkins > System Log > SonarQube Logs.
You can search the logs to find the name of a GitHub repo that is experiencing issues on their pipeline. For example, during this incident, we searched for darts-api.
However, we couldn’t see many logs relating to that repo. This indicated to us that the webhook wasn’t being reached from Sonarcloud.
That could mean there’s a issue with Sonarcloud or an issue on our end.
The next step was to check Sonarcloud by going to the webhook config, clicking on the three dots and clicking Show recent deliveries.
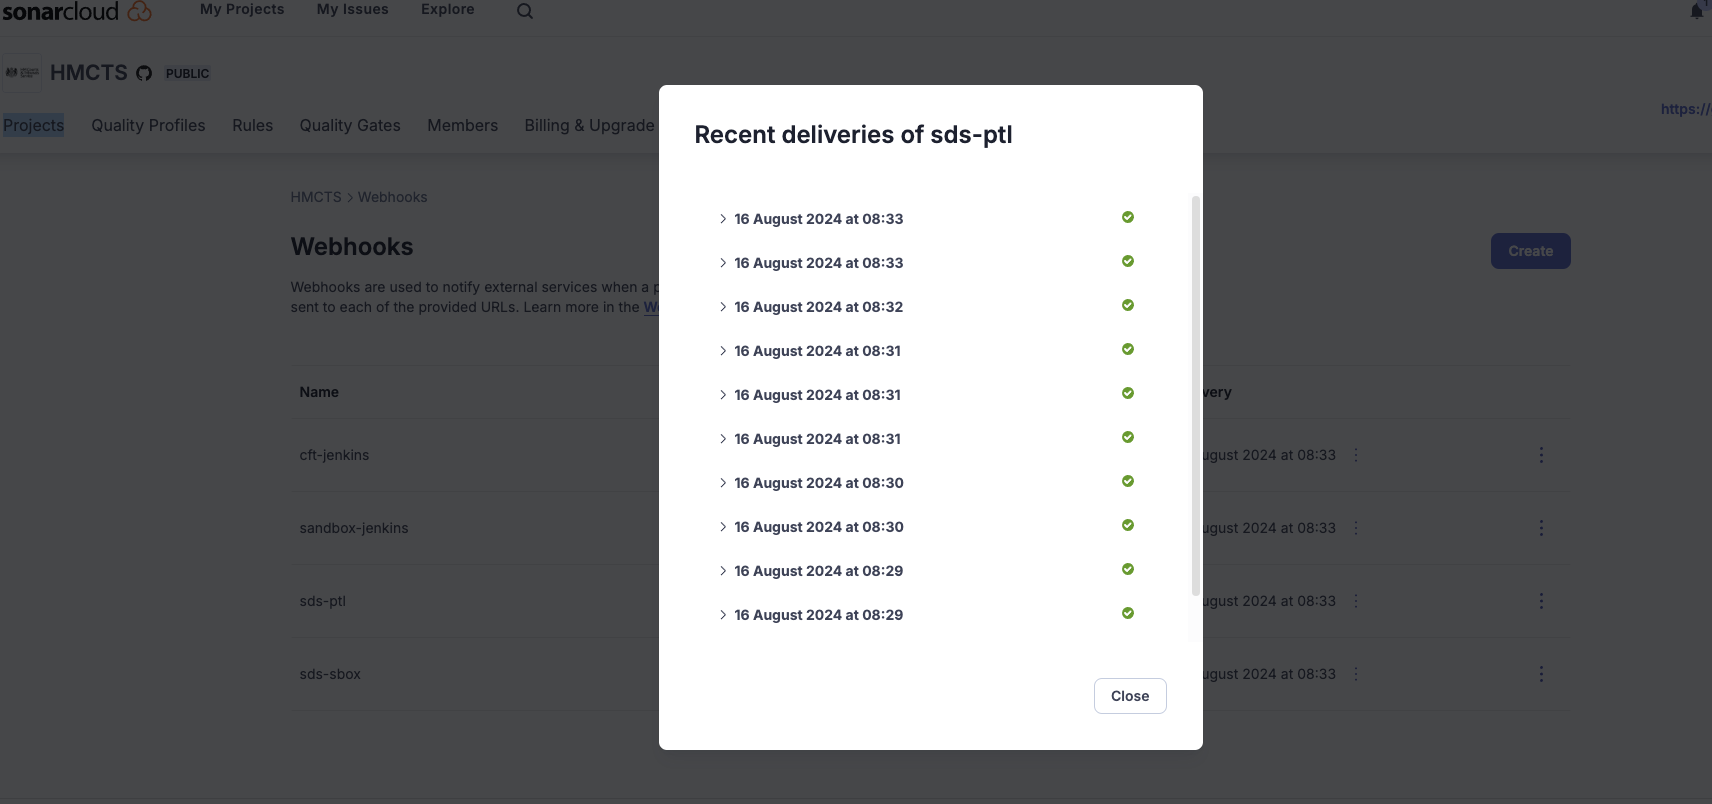
We could see that many of these were red instead of green.
Clicking on one will show you the error message. It was getting a 502 error.
You can grab the payload and try hitting the webhook from your terminal to see if you can successfully hit the endpoint.
You may receive a more descriptive error or it may succeed, which could indicate an issue on the Sonarcloud end.
An error like the below may indicate an issue with App Proxy, however you should be seeing tickets about Jenkins and other services not being reachable if there is an issue there as many services use App Proxy and not just the webhooks for Sonarcloud.
<h1> BadGateway: </h1>
    <h2 style="font-weight: normal; margin-top: -15px"> This corporate app can't be accessed. </h2>
    <div style="margin-top: 3%; width: 75%">
      <div id="NextSteps" >
        <h3> Next Steps </h3>
        The connection with the server was terminated.<br/>For more details, check the Application Proxy Connector Event Log for reported errors.
      </div>
      <div id="TraceInfo" style="margin-top: 2%">
        <h3> Quick Links </h3>
We discovered, during our investigations, that the webhook URLs in Sonarcloud were missing trailing slashes.
We’re not sure if these were always missing or recently got removed somehow as the webhooks were working fine until this ticket was raised.
The docs for the SonarQube plugin make this clear:
Configure a webhook in your SonarQube server pointing to <your Jenkins instance>/sonarqube-webhook/. The trailing slash is mandatory!
Admin access
At the time of writing (August 2025), the following PlatOps people have admin access to sonarcloud:
- Alex Bance
- Enda Kelly
- Tyler McDowell
- Thomas Thornton
- Satya Chundur
- Felix Eyetan