Prometheus/Grafana Patching Example
This document is a guide to patching Prometheus/Grafana stack on AKS.
Prometheus/Grafana patches should be tested in sbox first to avoid downtime in other environments.
It is important to understand what changes are in the version upgrade, especially if there are any breaking changes. Prometheus provide an Upgrade document for each version they release which should help to understand the changes in major versions
There should be a renovate pull request in the flux repo that will contain release notes that show you the breaking changes however there can be many release notes included depending on how long it has been since the last patch and how many versions of the Prometheus chart have been released in that time.
For example when patching from 79.11.0 → 81.6.3 there were 59 new versions of the chart released.
Be mindful that the PR in this instance didnt include the CRD update so it is not simply a case of merging this PR.
Patching Sandbox
In order to allow patching of sbox only, a new directory can be created for the updated crd URLs:
apps/monitoring/kube-prometheus-stack-crds-upgrade-v81/kustomization.yaml
which is a copy of the existing file with updated version numbers.
apps/monitoring/kube-prometheus-stack-crds-upgrade-v81/kustomize.yaml
which contains:
apiVersion: kustomize.toolkit.fluxcd.io/v1
kind: Kustomization
metadata:
  name: prometheus-crd
  namespace: flux-system
spec:
  path: ./apps/monitoring/kube-prometheus-stack-crds-upgrade-v56
See example PR containing these files
Using this method allows us to target specific environments with the new CRD deployment.
To use these files we can patch the desired cluster with this new directory in the base kustomization file e.g.: clusters/sbox/base/kustomization.yaml
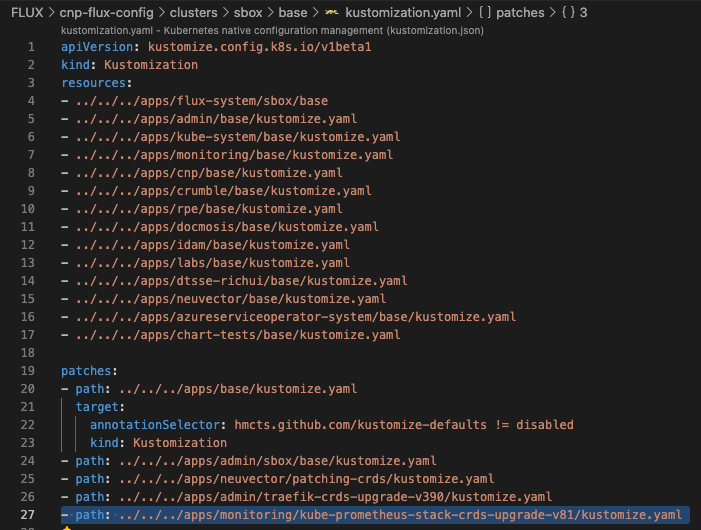
- path: ../../../apps/monitoring/kube-prometheus-stack-crds-upgrade-v81/kustomize.yaml
With the new crds version now available, a patch can be added to the sbox 00 & 01 config files to update the version of the chart for sbox only, example:
chart:
spec:
  chart: kube-prometheus-stack
  version: 81.6.3
  sourceRef:
    kind: HelmRepository
    name: prometheus
    namespace: monitoring
When ready, raise a pull request for review, example PR
CI Checks will be carried out to make sure the changes you’ve made are valid and will apply successfully when merged (these can be found in the tests folder).
Review the pipeline checks for errors. If there are no errors and the PR has been approved, merge the PR.
Verify Flux has applied the changes successfully
Check Pods are online
Using kubectl, check the pods are online and have a short uptime, denoting a newly created pod
kubectl get pods -n monitoring | grep kube-prometheus-stack
output:
kube-prometheus-stack-operator-6944864b75-2d5nb 1/1 Running 0 19m
Check Pod versions
To confirm that the update took place you can check the new pods have the correct chart version:
kubectl get pod {pod-name} -o yaml -n monitoring | grep -E "app.kubernetes.io/version|chart"
which should return the relevant fields
    app.kubernetes.io/version: 81.6.3
    chart: kube-prometheus-stack-81.6.3
Also, you can check on the Helm release to see if it has got the correct version in the output.
kubectl get hr -n monitoring
which will return all HelmReleases in the monitoring namespace, look for the kube-prometheus-stack which should show the chart version now deployed:
kube-prometheus-stack 14d True Helm upgrade succeeded for release monitoring/kube-prometheus-stack.v2 with chart kube-prometheus-stack@81.6.3
Review pod logs for errors
Check pods for any obvious errors
kubectl logs {pod-name} -n monitoring
UI Check
Prometheus also has a UI which should be checked, i.e. Grafana.
Ensure the CFT and SDS dashboards are accessible (requires VPN access):
Optional - Delete HR to check it comes back online cleanly
The example commands below are for both CFT/SDS using prometheus:
kubectl get hr -n monitoring
kubectl delete hr kube-prometheus-stack -n monitoring
As the pods come online, you will need to go through the checks again to ensure everything is working as expected.
- Pods are up and running
- Logs show no errors
- Versions are all correct
Other non-prod environments
Carry out the same changes as described in this guide for all non-production environments in both SDS and CFT.
This should only be carried out out if sbox was successful in both SDS and CFT clusters
Prod environments
In the Flux repos there will be a renovate PR that can be merged but please check if the changes include the CRD updates as described in this guide:
Once the renovate PR has been merged, remove the previous patches from non-prod environments
Troubleshooting
Node contention
As part of the deployment of Prometheus it will deploy an exporter pod. This pod runs as part of a Daemonset and as such there will be one pod per node within the AKS cluster.
Even if the update works in Sandbox and many clusters it is possible to run into issues in any given cluster simply because a node is at its limit in terms of pods deployed there.
If you see errors in the operator logs similar to these:
ts=2026-02-12T16:10:09.539206544Z level=error caller=/usr/local/go/src/net/http/server.go:3677 msg="http: TLS handshake error from 10.48.80.180:38594: remote error: tls: bad certificate"
ts=2026-02-12T16:11:52.004166363Z level=error caller=/usr/local/go/src/net/http/server.go:3677 msg="http: TLS handshake error from 10.48.80.180:54058: EOF"
Then it is likely that not all exporter pods are online. The errors are confusing because they point to System nodes and IPs that are not shown by:
kubectl get nodes -o wide
There are 2 options to resolve this:
- Wait, when all pods are eventually deployed and running the logs will no longer show the error
- Kill a pod on the affected node to create space for the Prometheus exporter pod to schedule.
- The pod that you kill should be of low benefit/impact, the best option would be a completed cronjob pod