Troubleshooting builds starting slowly
There are two main reasons for builds starting slowly.
One is contention for the Queue lock.
The other is multi branch events not being processed in a timely manner.
Symptoms of the queue lock contention
- Builds not starting when ‘Build now’ is pressed
- Builds not starting when actions are done in GitHub like ‘push’ or creating a pull request.
More information can be found on the CloudBees support article.
Generally this will involve taking thread dumps with collectPerformanceData.sh and then analysing them in something like jstack.review.
To use it you will need to find the PID of the Jenkins controller which can be done by running jps
Run ./collectPerformanceData.sh to see what options you have.
Normally it’s run with something like:
command
./collectPerformanceData.sh  6 120 10
You can copy the tarball to your machine with:
(Replacing the pid if required, it’s 6 in the example)
kubectl cp -c jenkins jenkins-0:/var/jenkins_home/performanceData.6.output.tar.gz performanceData.6.output.tar.gz
Given we have no support contract for Jenkins you will likely need to either pin to the last working version (this can make upgrades very difficult so try avoid it) and report an issue on the plugin’s issue tracker or create a fix ourselves (recommended).
Multi branch events not being processed in a timely manner
There are two likely causes for this.
- Events aren’t actually arriving or are coming slowly because of a problem on the GitHub side
- Jenkins can’t process the queue quick enough
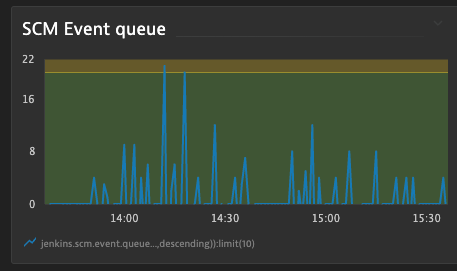
CFT Jenkins publishes metrics about the event queue to dynatrace.
You can see the events queue size on the CFT Jenkins dashboard.
As long as it’s under 50 or so it’s fine. During previous issues it was up to 1500+ which caused multi hour delays to builds starting.
There are additional metrics that you can look at like pending and running.
These can be checked in the Dynatrace metrics explorer, search jenkins.scm.event.
If Dynatrace isn’t working or you’re using SDS which doesn’t currently have Dynatrace you can get the metrics directly at the current point in time by running the below script in the Jenkins script console
jenkins.scm.api.SCMEvent.executorService
You should see something like:
Result: java.util.concurrent.ScheduledThreadPoolExecutor@8b0291b[Running, pool size = 10, active threads = 10, queued tasks = 84, completed tasks = 21888]
Logs can be found in /var/jenkins_home/logs/jenkins.branch.*.
They aren’t terribly useful, @timja enhanced the logging in https://github.com/jenkinsci/branch-api-plugin/pull/305 but we didn’t end up investing time to try get it merged as it served its purpose but could be revived again if ever needed.
Builds not being triggered at all
When a pull request is submitted, updated or merged into master/main, a webhook event is triggered.
This event is processed and sent to an Azure Logic App which processes the request and sends it to an Azure Service Bus Queue.
The logic app and service bus queues are created by cft-jenkins-infrastructure and sds-jenkins-infrastructure repos.
The queue is polled by a pod on our AKS cluster and the event is then sent to Jenkins which kicks off a build.
This configuration ensures that, if a build is to be triggered when the clusters are off or Jenkins is otherwise unreachable, it will stored and retried when Jenkins is reachable again.
The Jenkins WebHook Relay repo controls the behaviour of the pod that polls the service bus queue.
The webhook relay pod is managed by a Keda scaled job. If the scaled job isn’t working, the pods will not be scheduled and the service bus queue will not be polled.
If this happens, builds will not be automatically triggered on Jenkins.
Teams can use the Scan Organisation Now function in Jenkins to trigger builds if there is an issue but we don’t want to encourage this behaviour as a general practice.
References
- My Jenkins build isn’t triggering when I push - Post by @timja on a previous issue we had with builds not triggering
