Camunda Troubleshooting
This page should contain guides and information to help troubleshoot the Camunda BPM deployment.
Application Config
Camunda application config is stored in 3 distinct areas:
Camunda source code - The application itself contains a set of default values that are used if no other is supplied i.e. we can override the values that have an environment variable assigned as well as a default:
${CAMUNDA_HISTORY_TTL:P5D}Helm Chart - The Helm chart is the next possible configuration option, values supplied here may override the default values within the source code file or add additional values such as secrets or hosted database connection details.
Flux - Flux is the final possible configuration option before deployment to AKS. There are 2 deployments via Flux, UI and API, and both have their own distinct configuration settings.
Its important to remember that this list is hierarchical i.e. Flux will override Helm Chart which will override Camunda source code. When troubleshooting, start with the Flux configuration options and work backwards to see if any issues arise.
Database Performance
There are many reasons a database cannot become a bottleneck for any service so we cannot document all of them here but we can document those issues that we have seen and resolved.
Database size
We have observed that the Camunda interface can become sluggish and unresponsive, leading to service timeouts and eventual 504 responses.
Our initial solution was to increase the DB SKU, thereby allocating more resources for the service to use. However, this is a temporary fix, not a long-term solution.
Through discussions with Camunda support, we were given several queries and directions for further troubleshooting. This led us to discover that our nightly cleanup job was not removing any records from the Production database.
We found that we were storing a significant amount of historical data in the database, which should have been cleaned up on a nightly basis.
While both Camunda and the database were operating correctly with no misconfigurations or bugs, it underscored the importance of maintaining a streamlined service. The database contains a total of 16 million records, representing years of work from multiple teams across HMCTS.
The way Camunda queries the database is the root cause of the performance issues. Each query must scan, parse, and return a dataset based on the provided criteria, which means it likely scans all 16 million records before returning the desired results.
This process heavily utilizes available resources. Given the shared nature of Camunda, this leaves no resources for other users.
Checking historical record numbers
Camunda Cleanup
Its possible to find the number of historical records held in the database in the Camunda UI.
- Navigate to the Camunda interface, the URL will depend on the environment.
When logged in you will need to access Cockpit
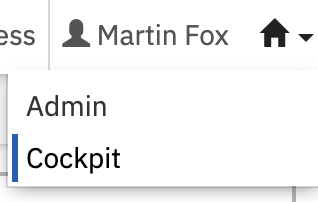
From here you have many new options for using Camunda, use the menu bar to navigate to
moreandcleanup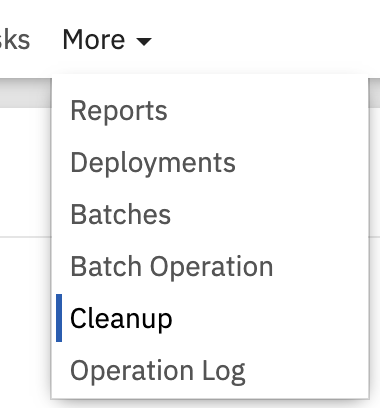
The cleanup page contains 2 sections,
cleanable dataandmetricsMetricsrelates to the clean up job that runs nightly, if no records are being removed over the past 7 days then there is likely a problem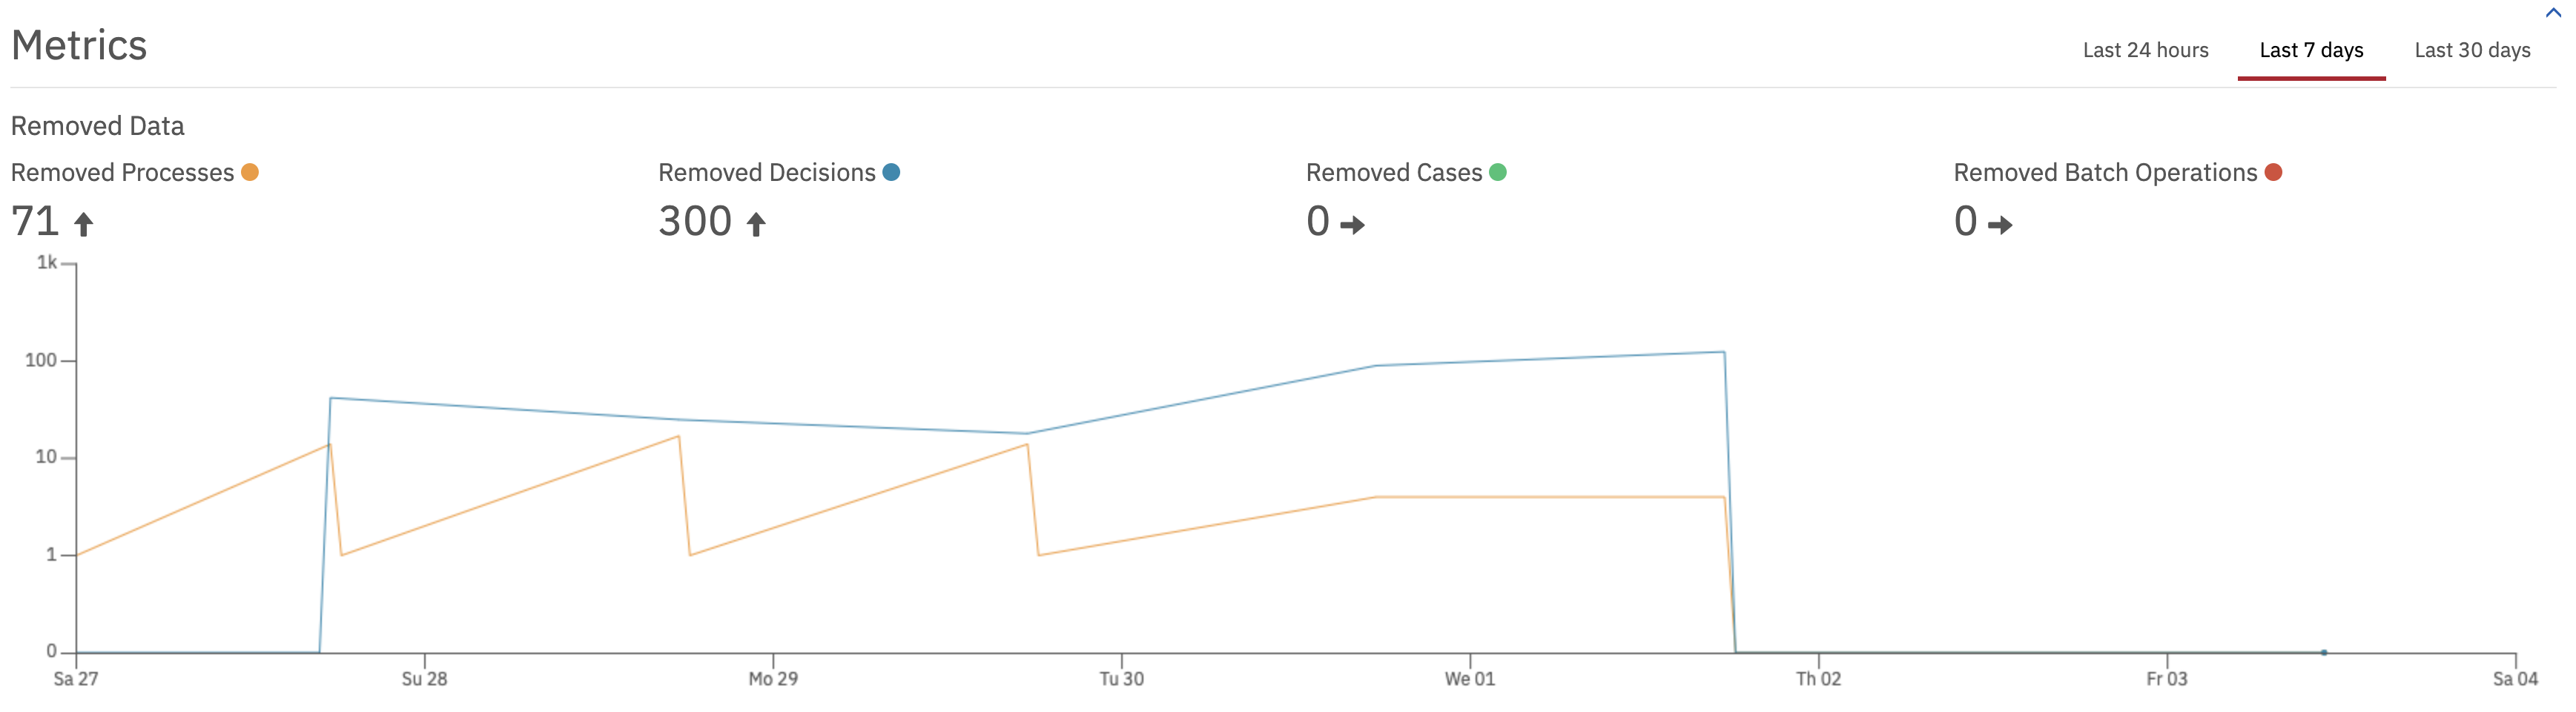
Cleanable Datais a list of definitions that have finished processes in the databases and how many of those are cleanable, it also shows theHistory Time To Livevalue for those records.Cleanable data is listed in order of most finished records so the biggest possible offenders will be on the first page shown of each type
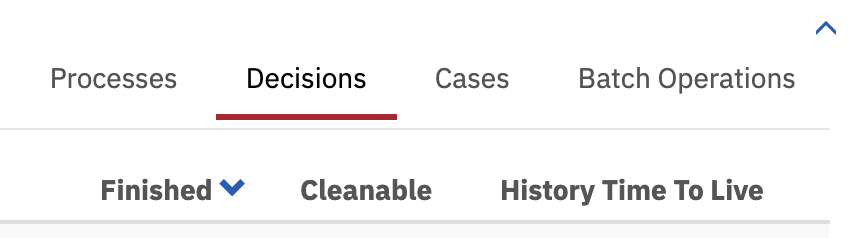
If
History Time To Livefor a definition isNullthat is a problem, those records will never be clean up by Camunda because Camunda cannot calculate aremoval timevalue. See this guide on adding removal times to records.If the
finishedcount is large and thecleanablecount is 0 that does not mean the records will not be removed, if there is aHistory Time To Livevalue set then it means that those finished records cannot be cleaned up yet but will be in future.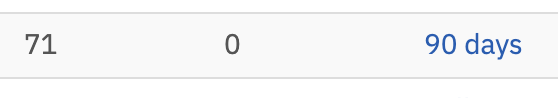
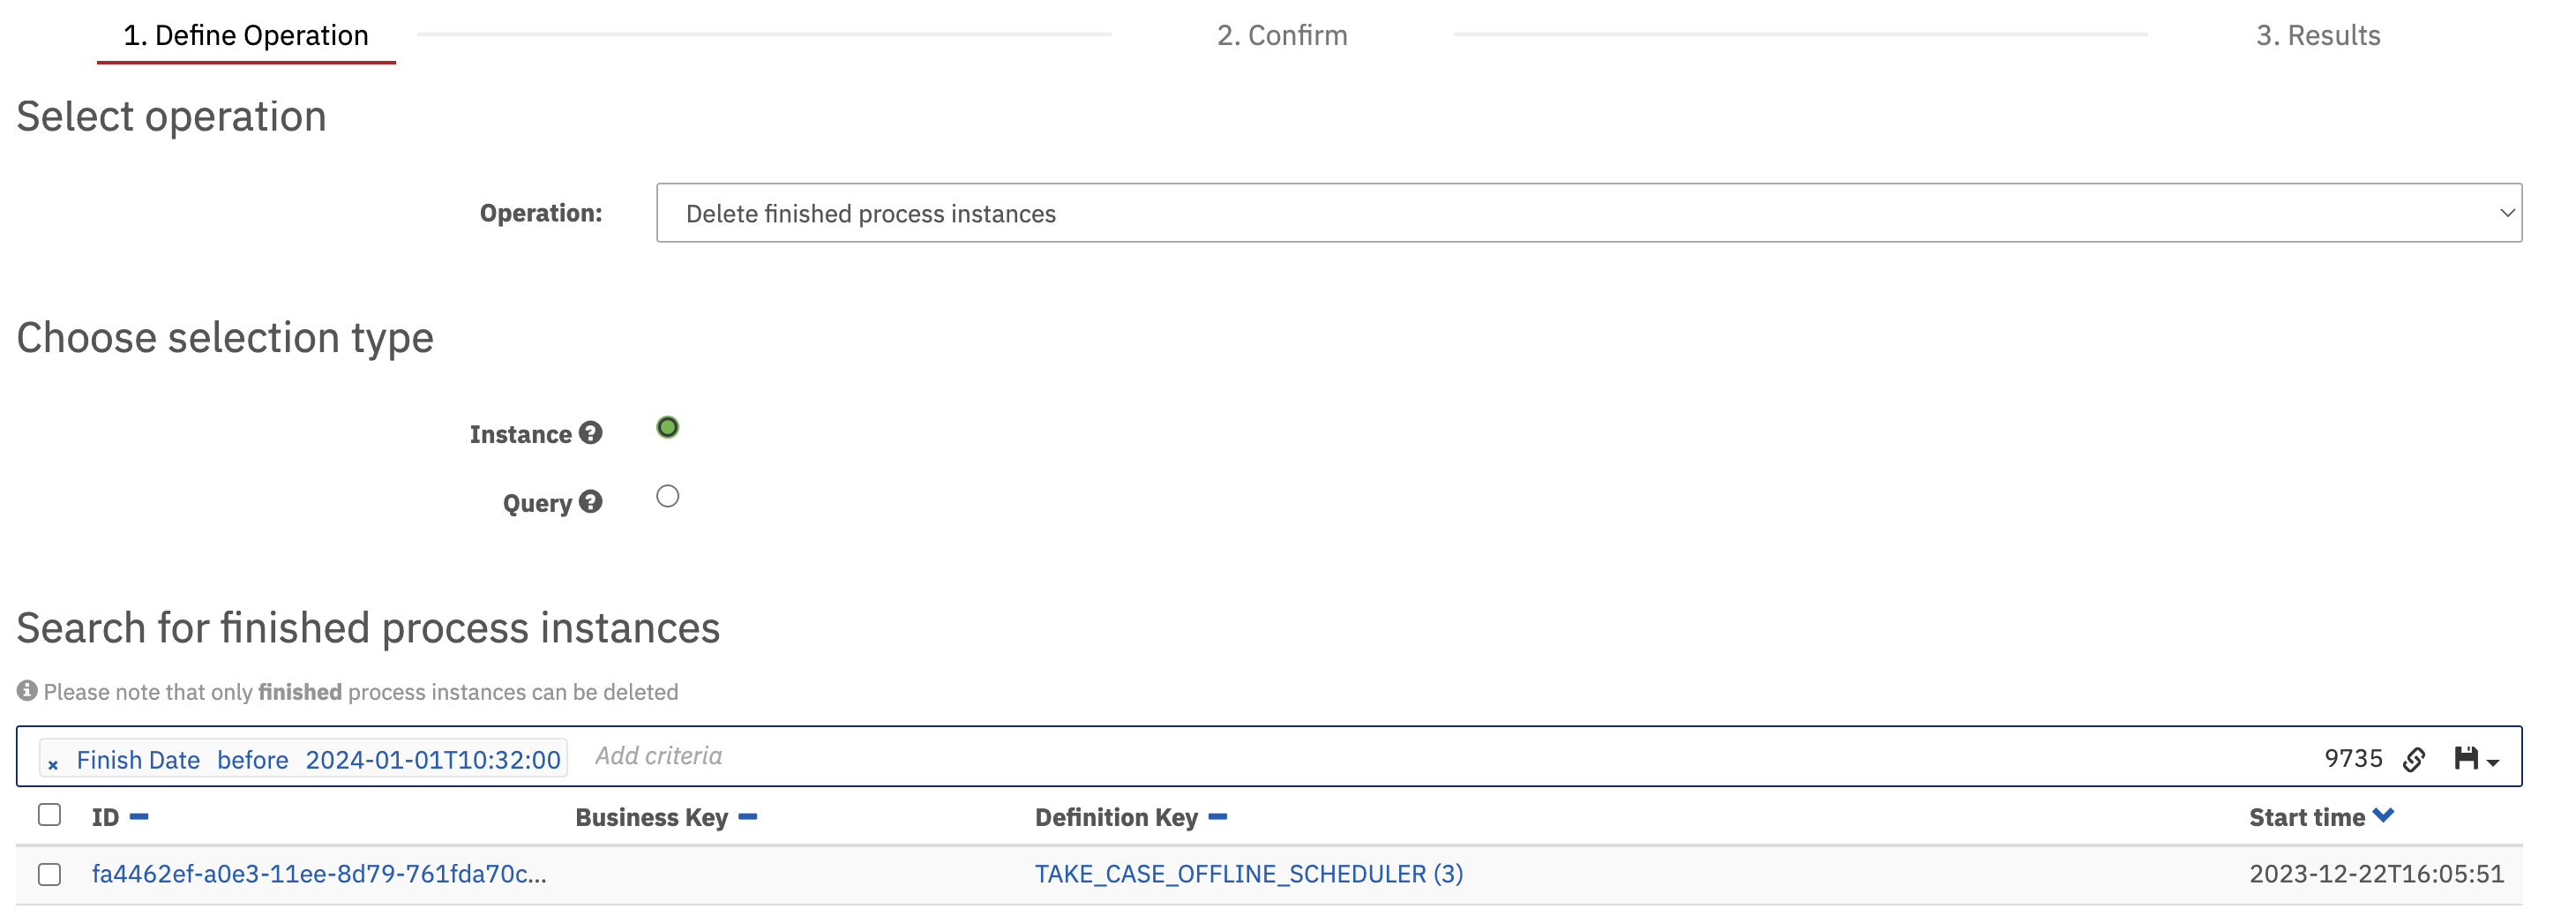
Camunda Batch Operations
It is also possible to get a single total number of finished processes or decisions but depending on how many exist it may create a large query to the database so you should first look at the above cleanable data page to see rough numbers before doing the following steps.
Whilst we do not want to carry out any batch operations, they do provide some initial information that can be useful and they have built in query types which are helpful.
Navigate to the menu again and
more->batch operation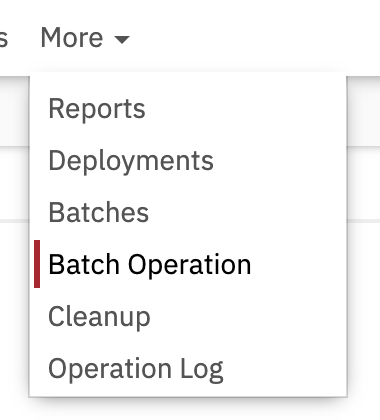
On this page you will find a number of fields, selecting
operationwill show a dropdown of available options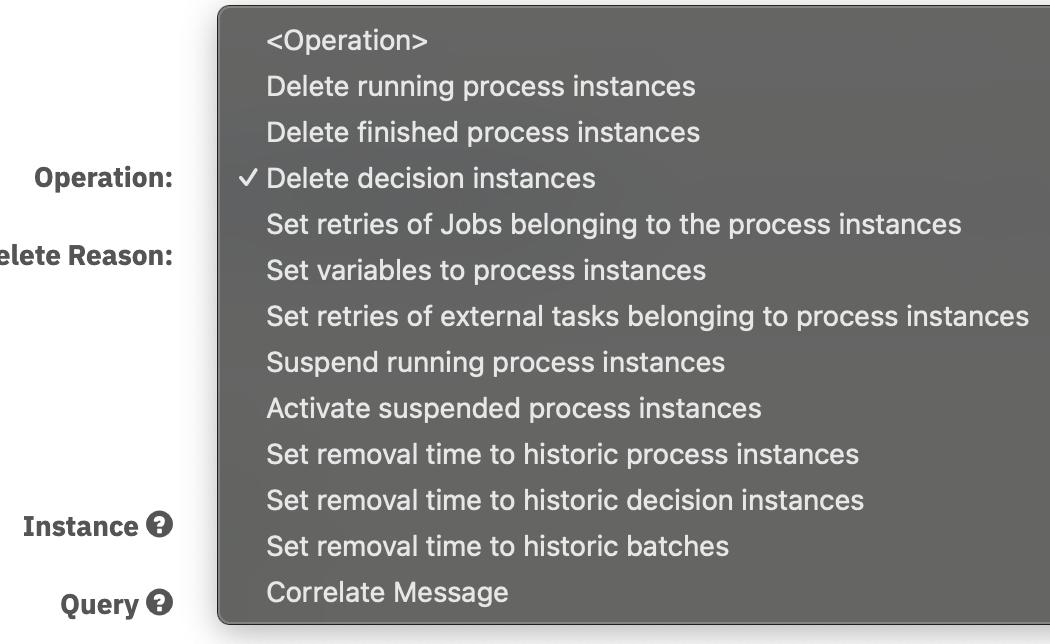
By selecting one of these options you will begin a select query to the database using the criteria of the operation e.g.
Delete finished process instanceswill search initially for ALL finished process instances in the database.To narrow down these results you can add search criteria. Clicking in the
add criteriasearch box will show a list of available options such as start date, finish date,incident statusand a host ofIDsoptions.